-
Cúrsaí

Cúrsaí
Tá roghnú cúrsa léinn ar cheann de na cinntí is tábhachtaí dá ndéanfaidh tú choíche! Féach na cúrsaí atá againn anseo agus an méid a deir mic léinn agus léachtóirí faoi na cúrsaí sin a bhfuil spéis agatsa iontu.
-
Saol na hOllscoile

Saol na hOllscoile
Chuile bhliain roghnaíonn os cionn 4,000 duine Ollscoil na Gaillimhe mar chéad rogha. Faigh amach faoin saol in Ollscoil na Gaillimhe anseo.
-
Eolas Fúinn

Eolas faoi Ollscoil na Gaillimhe
Bí ar an eolas faoin Ollscoil seo agus na fáthanna a bhfuil sí chomh speisialta sin – an stair thar a bheith spéisiúil a bhaineann leis an Ollscoil agus an nuacht is déanaí agus na hócáidí atá ar na bacáin.
-
Coláistí & Scoileanna
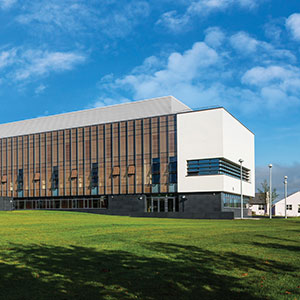
Coláistí & Scoileanna
Tá aitheantas idirnáisiúnta bainte amach ag Ollscoil na Gaillimhe mar ollscoil atá á treorú ag an taighde agus rún daingean aici teagasc den chéad scoth a chur ar fáil i réimsí éagsúla saineolais.
-
Taighde

Nithe Fónta á gCruthú as Smaointe Úra
Tugann ár dtaighdeoirí aghaidh ar chuid de na dúshláin is práinní san 21ú Céad.
-
Gnó & Tionscal
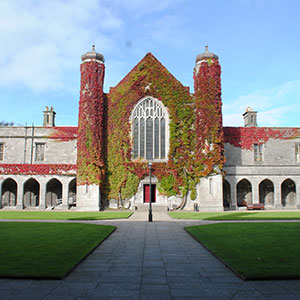
Tacaíocht do Thaighde Úrnua in Ollscoil na Gaillimhe
Déanaimid deiseanna tráchtála a chuardach agus a chothú don phobal taighde in Ollscoil na Gaillimhe, mar aon le comhpháirtíocht tionsclaíochta a chothú.
-
Alumni, Cairde & Lucht Tacaíochta
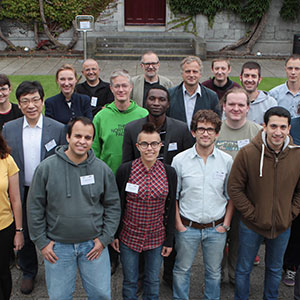
Alumni, Cairde & Lucht Tacaíochta
Tá os cionn 90,000 céimí de chuid Ollscoil na Gaillimhe ann ar fud an domhain. Déan nasc linn agus beidh teacht agat ar an gcomhphobal sin ar líne.
-
Rannpháirtíocht Pobail
Rannpháirtíocht sa Phobal
In Ollscoil na Gaillimhe, creidimid go n-éireoidh níos fearr leat más féidir leat an méid a fhoghlaimíonn tú a chur i bhfeidhm i do shaol féin. Is mar gheall air sin go bhfuil béim mhór ar shocrúcháin oibre nó ar thionscadail phobail i gcuid mhór dár gcúrsaí.








Power BI for Data Visualisation and Reporting

Power BI for Data Visualisation and Reporting
|
To enable participants to use Microsoft Power BI effectively for analysing and visualising data, creating interactive dashboards, and communicating insights in a clear and impactful way. Connect and import data from Excel, databases, and other common sources into Power BI. There are specific pre-requisites for the programme: a) You need a strong working knowledge of Microsoft Excel, gained from the workplace or by prior attendance on an IT course. Staff who are interested in this workshop should register via: Course Registration & Cancellations - University of Galway, search for “Visualisation”, and scroll down. If there are no upcoming dates, please register for the “waiting list” by selecting any date and we will advise you of new dates in due course. |